Birds are affected by the mass use of fireworks on New Year’s Eve up to a distance of 10 km away. With data from weather radars and bird counts an international team of researchers revealed how many birds take off immediately after the start of the fireworks, at what distance from fireworks this occurs and which species groups mainly react. ‘We already knew that many water birds react strongly, but now we also see the effect on other birds throughout the Netherlands’, says ecologist Bart Hoekstra of the University of Amsterdam. In the scientific journal Frontiers in Ecology and the Environment, the researchers therefore argue for large fireworks-free zones.
On New Year’s Eve, an average of 1,000 times as many birds are in the air close to where fireworks are set off as on other nights, with peaks of 10,000 to 100,000 times the normal number of birds. The effects are strongest within the first 5 km of fireworks, but up to 10 km there are still an average of at least 10 times as many birds flying as normal.
‘Birds take off as a result of an acute flight response due to sudden noise and light. In a country like the Netherlands, with many wintering birds, we are talking about millions of birds being affected by the lighting of fireworks,’ says Hoekstra.
Weather radar and bird counts
Last year, other researchers at IBED discovered that geese are so affected by fireworks that they spend an average of 10% longer looking for food than normal during at least the next 11 days. They apparently need that time to replenish the lost energy or to compensate for the unknown foraging area in which they have ended up, after fleeing from the fireworks.
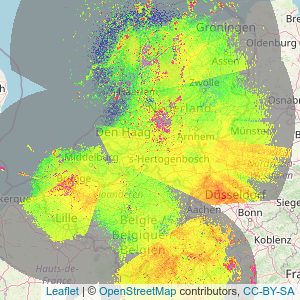
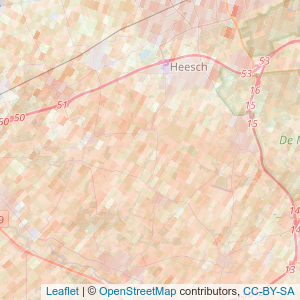
Hoekstra’s study looked at which species take off after fireworks and when this occurs. He used information from Royal Netherlands Meteorological Institute weather radars during both a clear New Year’s Eve and on other normal nights. He combined this with distribution data from Sovon – the Dutch Centre for Field Ornithology – based on bird counts by hundreds of volunteers. ‘We already knew that many water birds react strongly, but it was still unclear how birds outside these waterbodies react to fireworks. Through the counts we know exactly where which birds are and using the radar images we can see where they actually take off because of fireworks.’ Using the data, Hoekstra was able to calculate how many birds take off immediately after the start of the fireworks, at what distance from fireworks this happens, and which species groups mainly react.
The analysis makes it clear that in the study areas around the radars in Den Helder and Herwijnen alone, almost 400,000 birds take off immediately at the start of the fireworks during New Year’s Eve. Moreover, it appears that larger birds in open areas in particular fly around for hours after and at remarkable altitudes. Hoekstra: ‘Larger birds such as geese, ducks and gulls fly to a height of hundreds of metres due to the large-scale discharge of fireworks and remain in the air for up to an hour. There is a risk that they will end up in bad winter weather, or that they will not know where they are flying due to panic and accidents could occur.’
Because 62% of all birds in the Netherlands live within a radius of 2.5 km of inhabited areas, the consequences of fireworks are high for all birds throughout the country. ‘Flying requires a lot of energy, so ideally birds should be disturbed as little as possible during the cold winter months. Measures to ensure this are especially important in open areas such as grasslands, where many larger birds spend the winter. The effects of fireworks on birds are less pronounced near forests and semi-open habitats. In addition, smaller birds such as tits and finches live there, which are less likely to fly away from disturbance.’
The authors argue for fireworks-free zones in areas where large birds live. Hoekstra: ‘These buffer zones could be smaller in areas where light and sound travel less far, such as near forests. Furthermore, fireworks should mainly be lit at central locations in built-up areas, as far away from birds as possible. It would be best for birds if we moved towards light shows without sound, such as drone shows or decorative fireworks without very loud bangs.’
Original press release
]]>
 Example visualizing birds and velocities from meteorological radar data
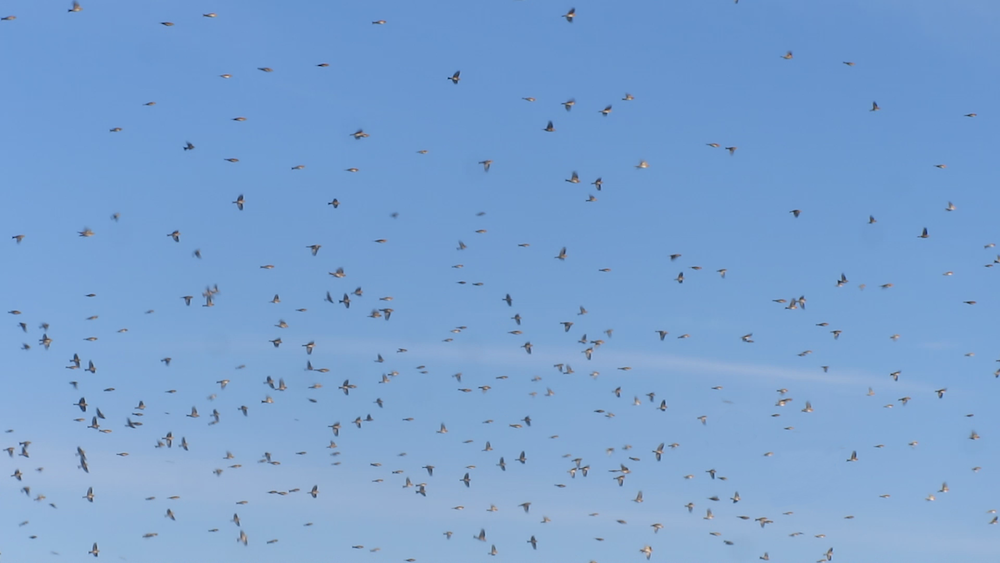 Figure 1. Flocks of diurnal migrants are easily observed by field ornithologists aka citizen scientists, like this flock of about 4000 bramblings Fringilla montifringilla in Southern Finland in October 2020 (Source: Nadja Weisshaupt).
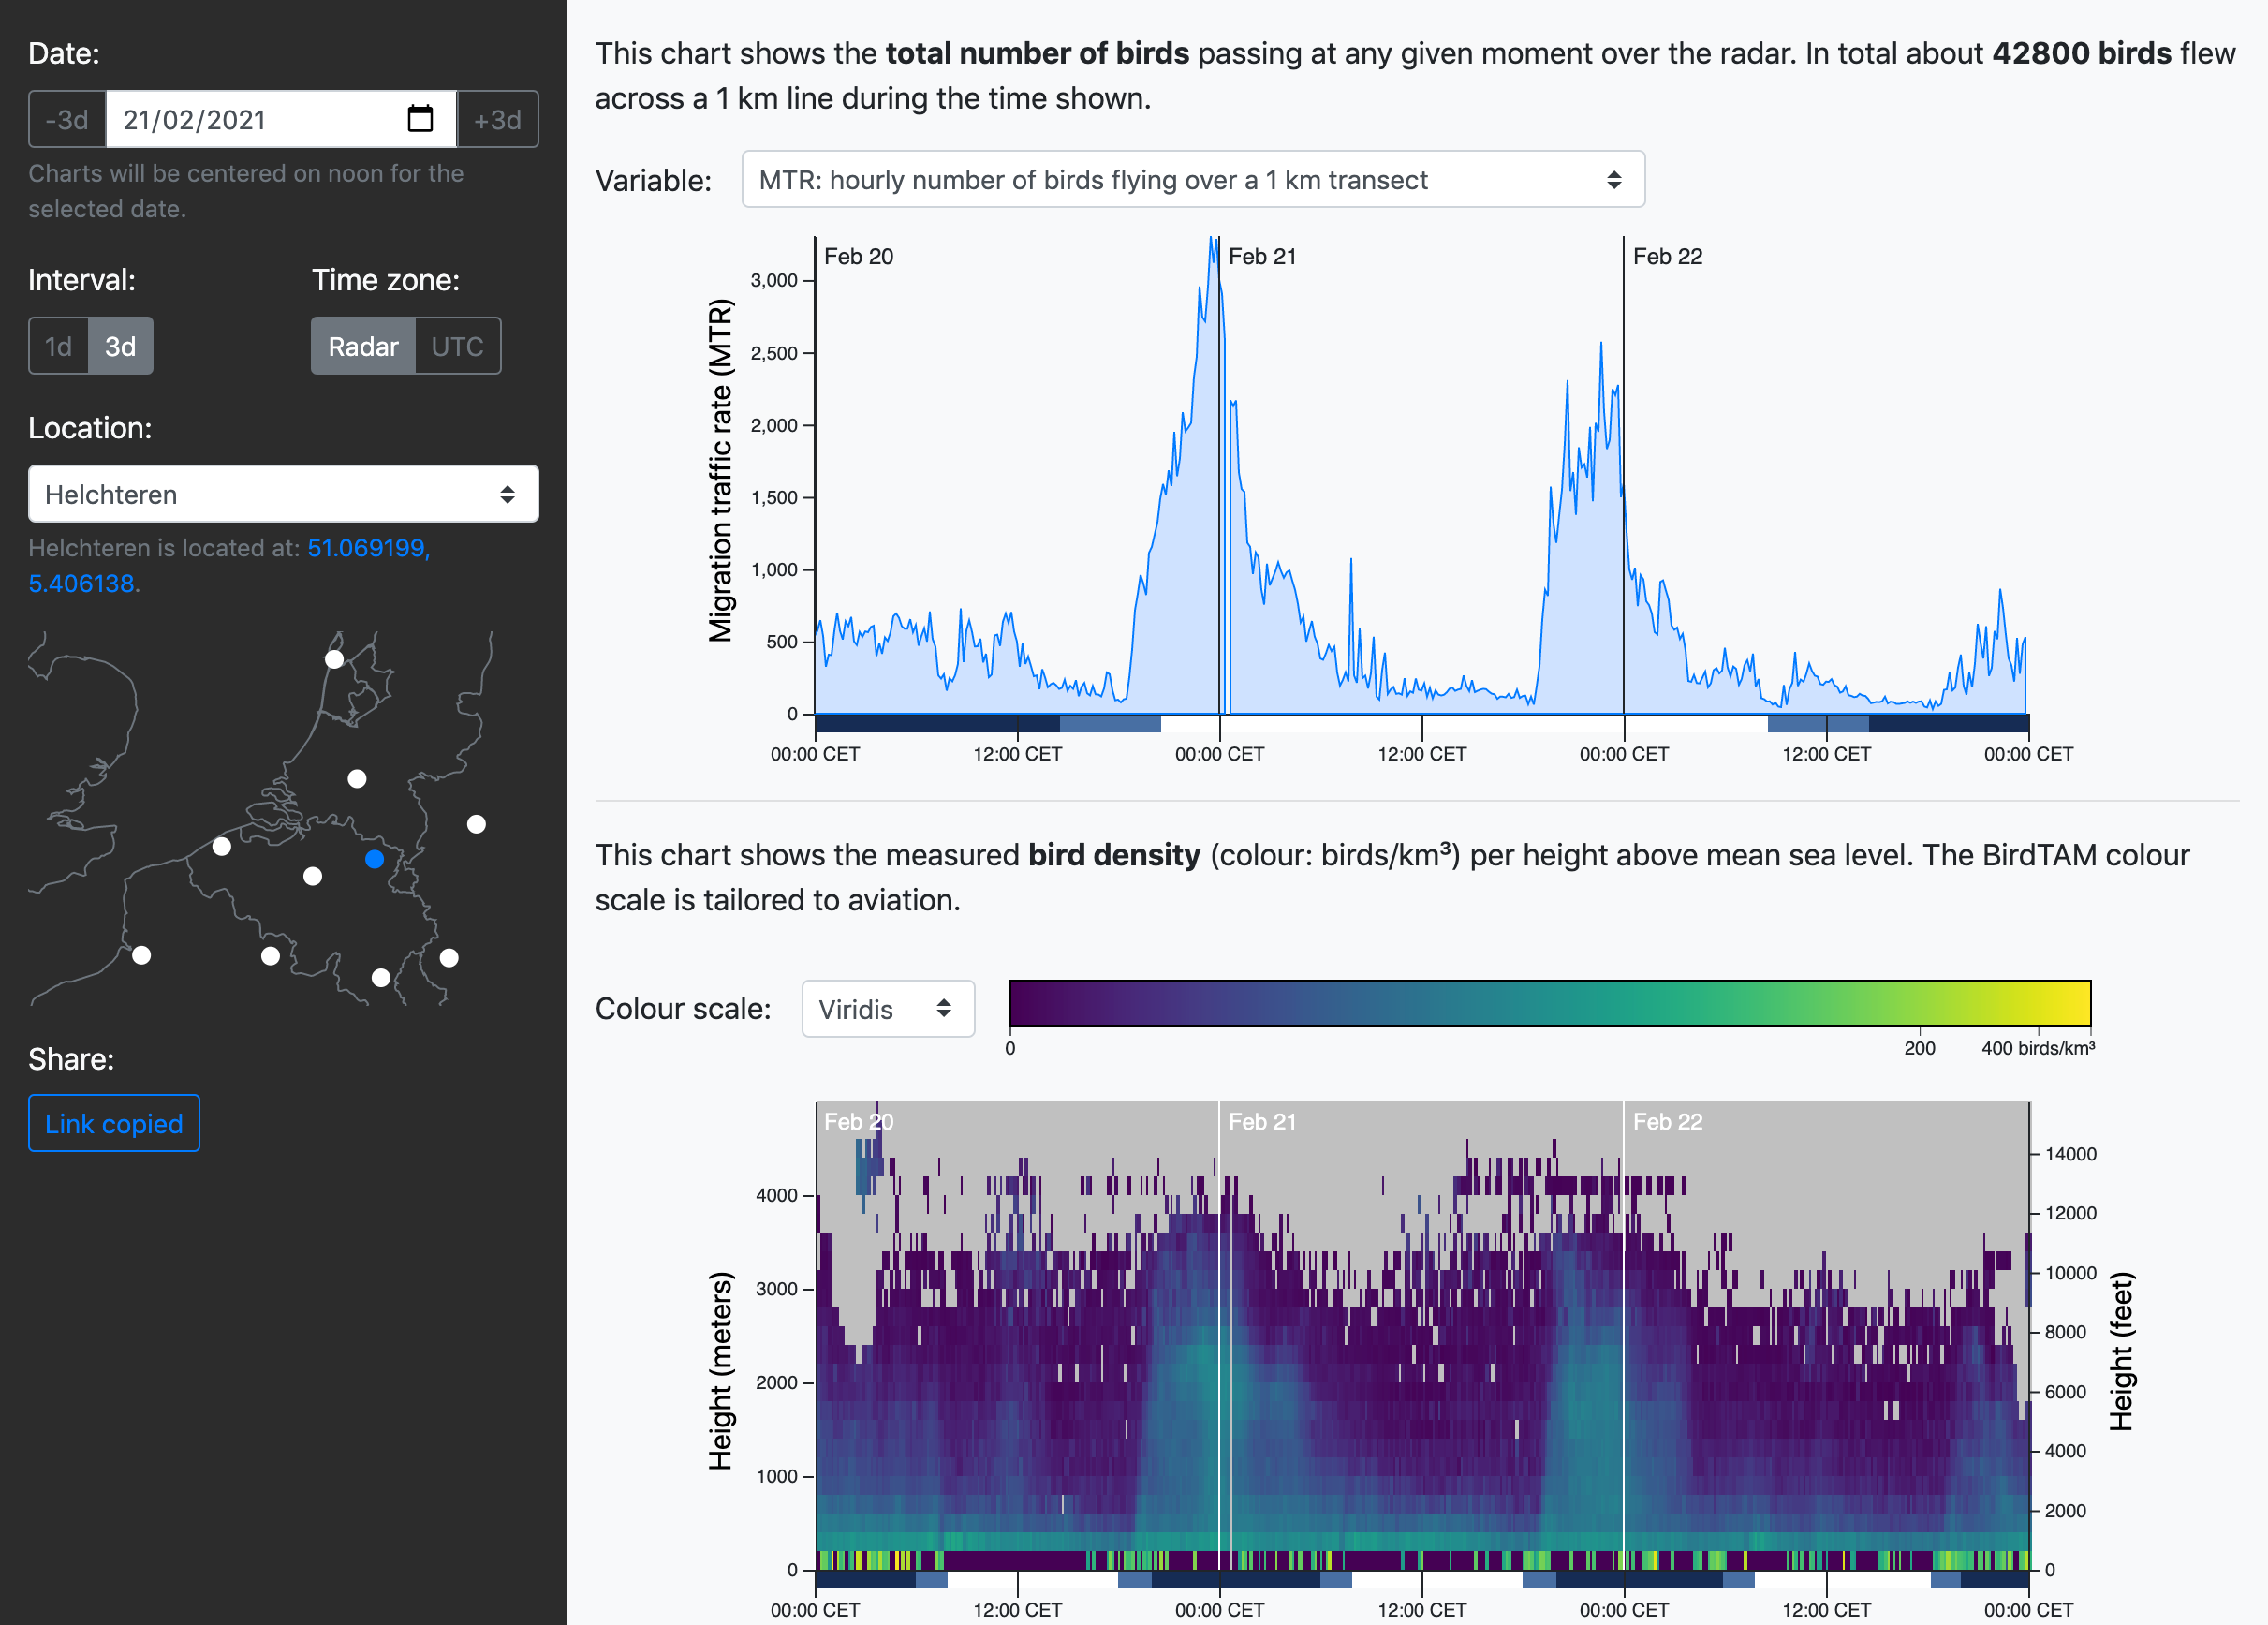
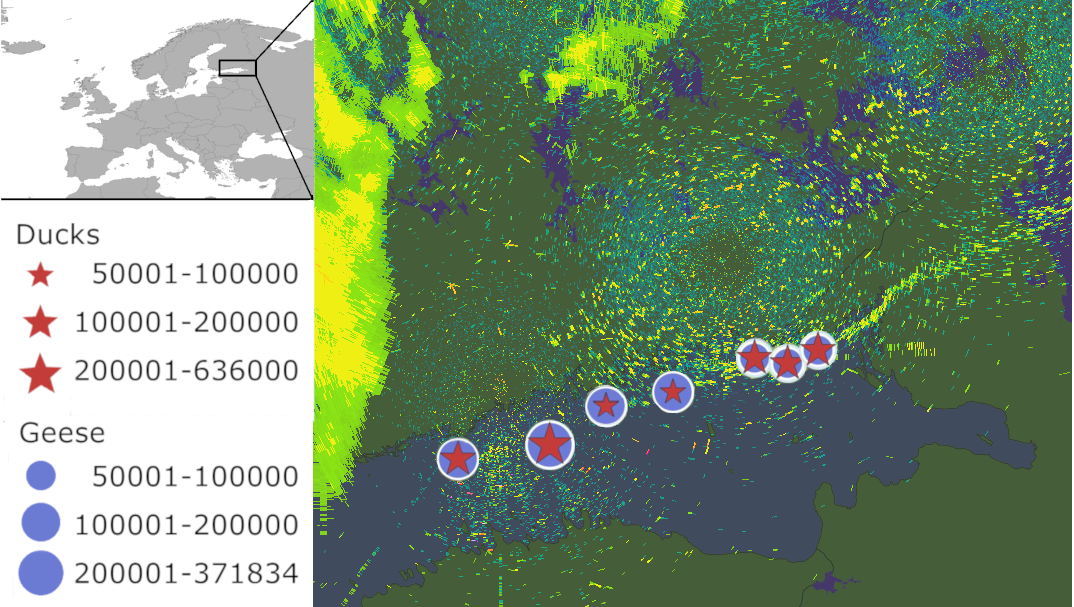 Figure 1. Arctic waterfowl migration in the Gulf of Finland as depicted by weather radars on 17 May 2017 and locations of bird observations reported on the Finnish bird portal Tiira.
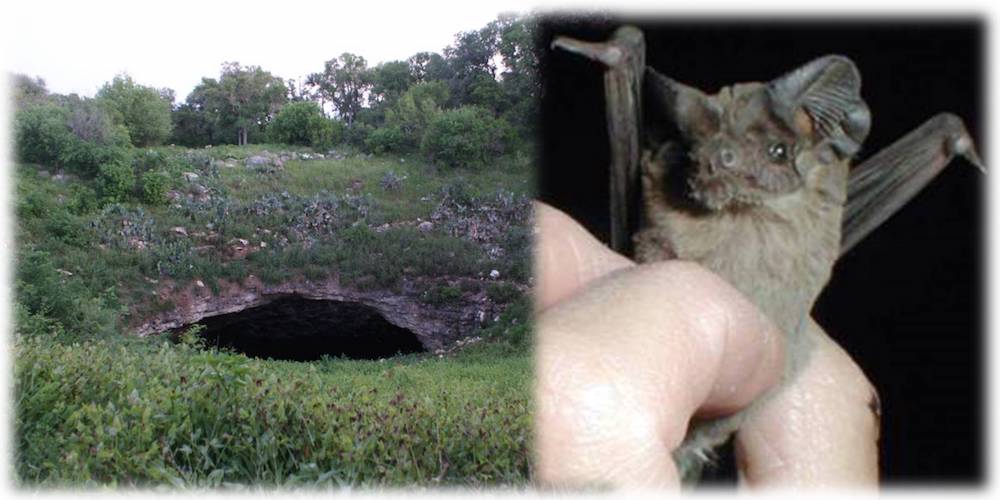 Left: Bracken Cave in Texas, USA (Source:
 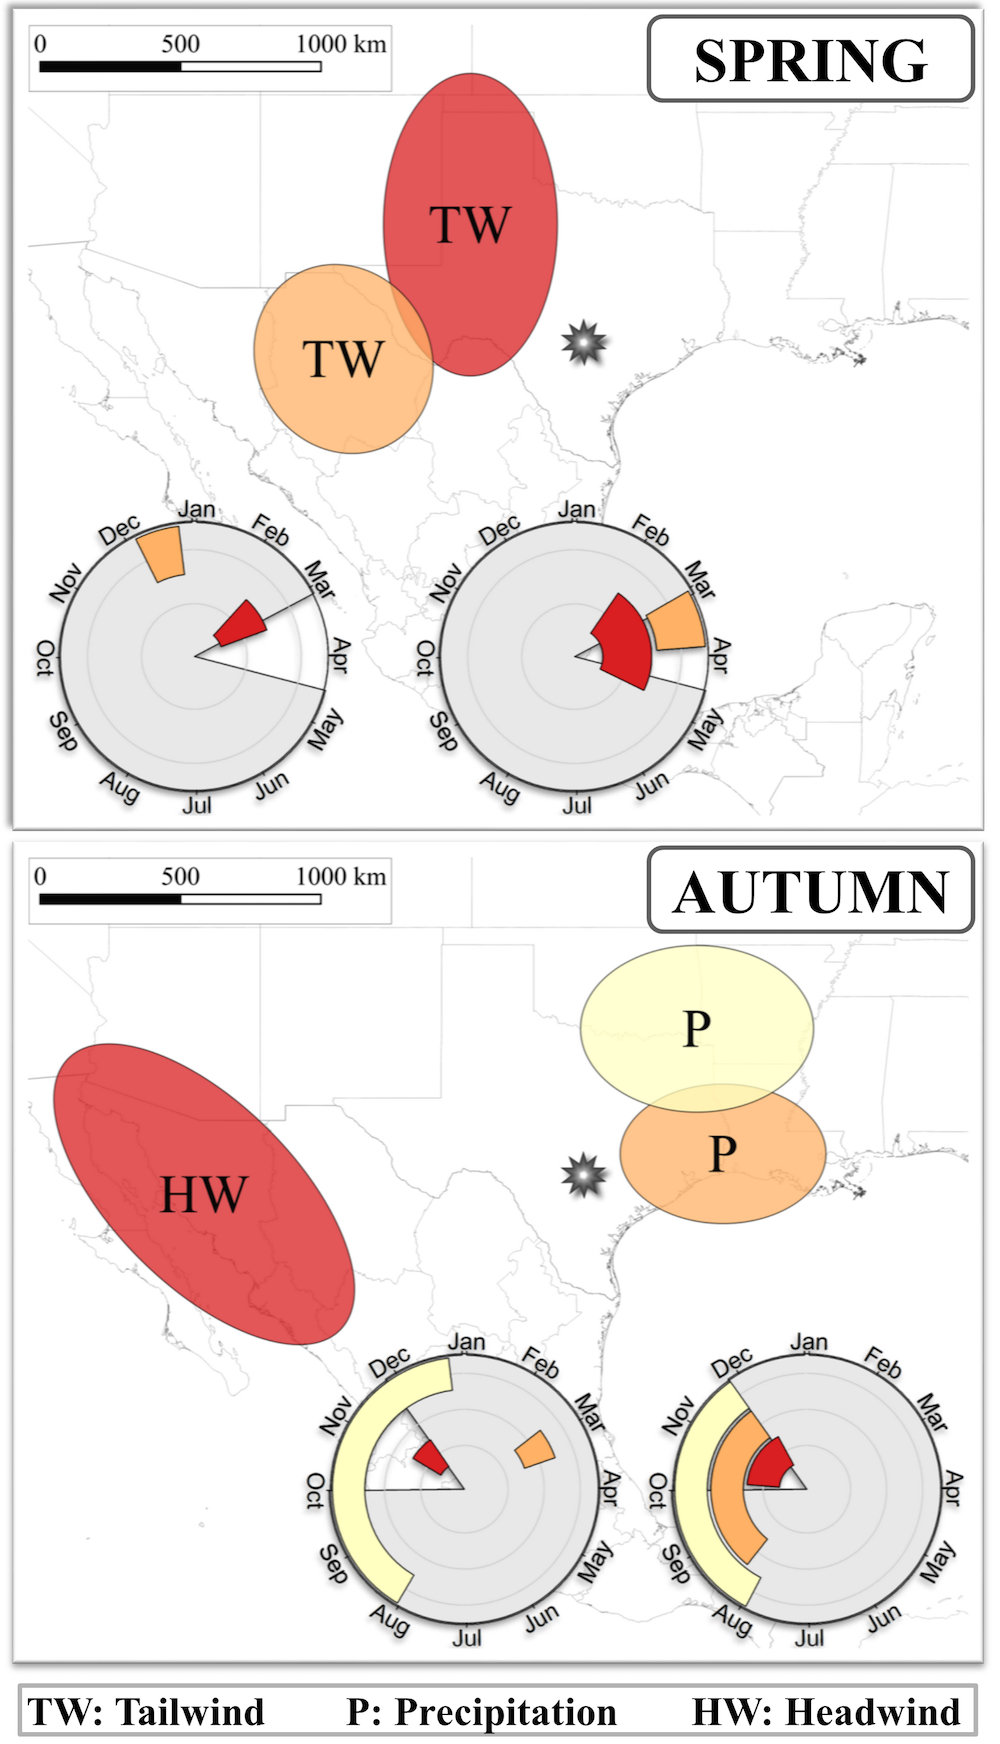 Location and timing of the identified most important weather variables that are likely to influence spring and autumn migration timing at Bracken Cave. The timelines in each plot represent the period of the single best time window (left) and of the medians for the time window opening and closing of the 95% confidence interval of all time windows (right). P: precipitation; HW: headwind; TW: tailwind. The location of Bracken Cave is marked with a star. The white background triangles in the time window subfigures represent the migration period at Bracken Cave, i.e. the period between the earliest and latest estimated average migration time at Bracken Cave over the entire study period.