starsTileServer visualizes large spatial data sets
Making large spatial data sets accessible for dynamic visualization is challenging, starsTileServer facilitates this.
New technologies were needed to address the challenge of visualizing large archives of weather radar data and bird specific products interactively. The goal of the R package starsTileServer is to provide a simple way to add large data sets to a leaflet or shiny application.
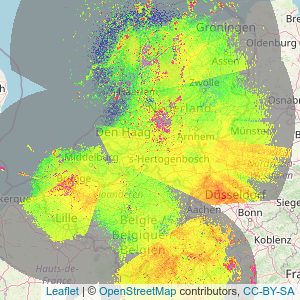
 Example visualizing birds and velocities from meteorological radar data
Although the need arose from visualizing radar data the application is more general. Because it is possible to provide custom functions pretty much any data that can be projected, can be visualized, including composites or non square grids.
More examples are available on the website. The website also shows how applications can be made scalable. Using this it is possible to generate the images needed for longer animations like this one:
Now also with video pic.twitter.com/CwzEHtAS5F
— Bart Kranstauber (@bart_kra) November 24, 2021